Applying User Metrics To Score And Rank Mobile Apps: Forrester’s App Engagement Index
Do you measure the success of your app? And if so, how do you define success?
App success depends on both the type of app and the purpose of an app; in general, we can't measure success just by counting the number of downloads or looking at the time spent with the app. But for certain apps, such as communication, dating, games, movies, music, news/media, social networking, and sports, it's easier to define success: The more engaged a user is, the better.
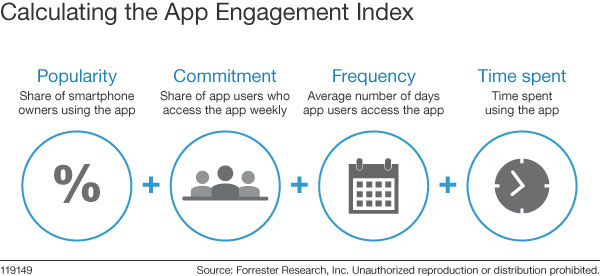
To help marketing leaders and app providers evaluate and benchmark these apps as consumers embrace the mobile mind shift, Forrester has created the App Engagement Index. We use actual smartphone behavior collected from more than 3,000 US and UK smartphone owners who have agreed to supply their data — permitting precise usage analysis at a detailed level.* The Index analyzes every app used by more than 2% of the panelists and rates its user engagement and relative performance across four metrics:

The Index combines these metrics, scores each app from zero (not engaging at all) to 1,000 (the maximum possible engagement), and places it on a spectrum of four segments: addicting, engaging, enticing, and intriguing.

The App Engagement Index allows you to benchmark your app — or apps with which you wish to partner — against every other app on the spectrum. Marketing leaders can build appropriate relationships with apps that suit their marketing objectives, while the developers and customer experience professionals providing these apps can benchmark their engagement performance.
We are introducing the App Engagement Index using data from July 2014 to September 2014 from Forrester’s Consumer Technographics® Behavioral Study. We found that for US consumers during this time period:
- Facebook is the most engaging app on the App Engagement Index. More than half of its app users access it weekly — and they spend more than triple the amount of time using it than the average for apps in the study.
- Despite attracting audiences of a comparable size, the Instagram app engages users for twice as long as the Twitter app, resulting in a higher score on the App Engagement Index.
- While the CNN app garners a larger audience, almost half of USA Today app users go back weekly, propelling it to the top of the news/media category on the App Engagement Index.
Register now for the webinar where we introduce the App Engagement Index on November 10, 2014, 11:00 a.m.- 12:00 p.m. EST. We will update the Index and make it available for viewing on a quarterly basis for both the US and the UK. Forrester Technographics clients can request the App Engagement Index scores via their data insights managers. While these scores reflect all US and UK online smartphone owners, ask your data insights manager about scores tailored for your target demographic or audience. Not a Technographics client and interested in accessing rich behavioral data metrics and insights? Contact us at data@forrester.com.
* Forrester's App Engagement Index does not evaluate apps based on the features available within the app or whether the app meets customer needs. We calculate the Index using app user behavior and not self-reported user experience.