It’s Time To Help Me Benchmark!
That’s right: It’s time for us to start thinking about our annual US Consumer Benchmark report. We are currently in the field with our annual mail survey of more than 40,000 US consumers ages 18 and up and are eagerly awaiting the return of the data. While we wait patiently (or not so patiently), it’s time for us to start preparing for our annual Benchmark report. Many of you are already familiar with this mega-data report that we publish each year based on our Technographics® data. For those of you who aren’t, let me get you up to speed!
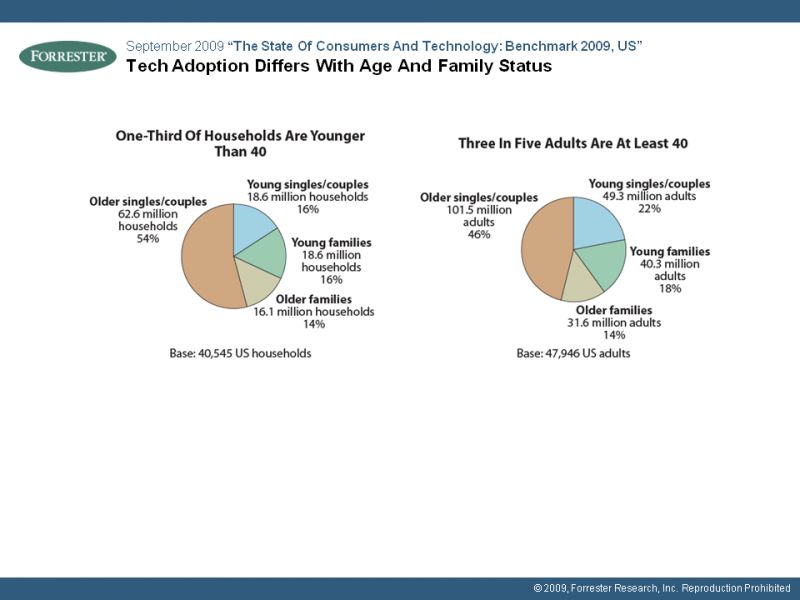
Each year, we do a thorough analysis of our Benchmark mail survey and create a report called “The State Of Consumers And Technology.” This report covers everything from device ownership to online activities to mobile behaviors, and it serves as the Holy Grail for many market researchers. At more than 20 pages long, this report is an absolute labor of love and takes many hands to make it happen. And this year, we need your help, too! When we begin writing this document, we always start by choosing a lens to use throughout the analysis. Last year, we looked at life stages:
The requirements are that we find a lens that has a maximum of about five groups and that will yield an interesting perspective on the data. (We always test this aspect before finalizing our lens. As you know, some things often sound interesting but in reality don’t quite “pop” in the data.) So this year, I am turning to all of you to solicit ideas for what our lens should be. How do you want to see all of this data analyzed? What would be most helpful to you as a market researcher?
I can’t wait to see what ideas you all have! After I comb through the ones I receive, I’ll post a poll with the top contenders so that you can vote on which one you like best. Help me out by sharing this blog post with others you know who might be interested as well. You can send me submissions as comments here, through email at: jranderson@forrester.com, or through Twitter: @jaranderson.
I’ll be posting on the development of the report as we start analyzing the data, so be sure to check back for more updates and some sneak peeks at the data.
Thanks in advance for your help!