Bad Economy? Bad Markets? Use Statistical Analyses to Inform Your Next Moves
- Many factors affect your business – economic and market conditions, prices, marketing tactics, sales activities, technology trends
- Comprehensive and objective statistical analyses clarify the importance and timing of each business driver
- Translate the statistical results into impacts on your pipeline inflow and bookings, and then use simulations to optimize the marketing mix
The Wall Street Journal reported recently (September 25) that third-quarter earnings are expected to fall for the sixth straight quarter. By now, the economy was supposed to be accelerating and earnings were supposed to be rising, not falling. Is a recession looming over the horizon? Nobody knows, but probably not. However, declining earnings could be a problem. With less money to spend, businesses may tighten their belts and actually spend less. What’s a planner to do?
First, even though you don’t control these external factors, you need to understand how economic and market conditions affect your business. You also need to understand the timing of this relationship. How do you do this?
- Compile data on your pipeline opportunities, bookings or revenue from internal sources. Three or four years of monthly data will be needed.
- Compile data on your markets from secondary and/or third-party sources. Revenue or employment by industry works well for this. Three or four years of monthly data will be needed.
- Put the data in columns in Excel and create “lagged” versions of the market data. The market data that you compiled represents current activity in your markets on a month-to-month basis. It is possible that your business responds immediately to changes in the market. That is, changes in your markets this month affect your pipeline opportunities, bookings or revenues this month. However, if you are like most businesses, changes that occurred in your markets three to six months ago probably have more impact on your business today.
- Check the correlations between changes in your business metrics and changes in current and lagged versions of your market measure. You can generate the correlations in Excel.
- You might find that all versions of your market measure have reasonable correlations – let’s say, above 0.5. But you will probably find that the current version has a lower correlation coefficient than a lagged version. This is telling you that your customers started making spending decisions four, five or six months ago.
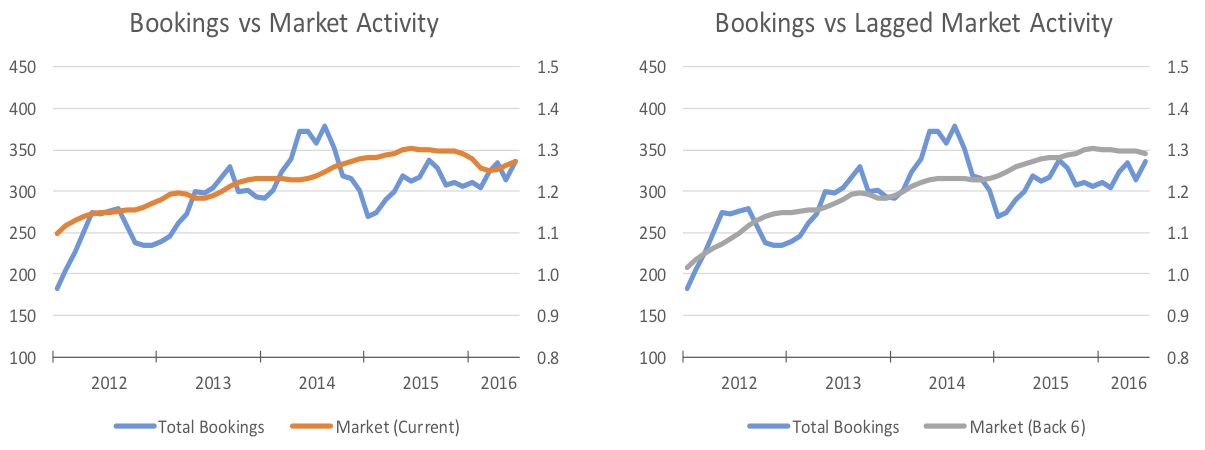
- You can visually inspect the results as shown below. The chart on the left shows bookings relative to the current version of the market measure. The chart on the right shows bookings relative to the market measure lagged six months. (That is, data from six months ago is moved into the current month, data from seven months ago is moved into last month, data from eight months ago is moved into two months ago, etc.) If you look closely at the two charts, you will see that the lagged market measure on the right is more closely related to bookings. You can quickly confirm this statistically by using Excel to generate bivariate regressions using the data in each chart.
- Once this analysis is completed, you will not only understand the relationship between your business activity and market conditions, you will also have a leading indicator of the general direction of your business over the next few months.
Second, do the same type of analysis using data on factors that you control. Compile your data on:
- Digital activity (sessions, page views, users, duration, downloads of key relevant content, tools, and trials)
- Email activity (sent, opened, viewed, clicked through)
- Other marketing tactics (teleprospecting, events)
- Sales activities
Put all of the data in Excel, create lagged versions of every data series, and calculate the correlation coefficients. Select the versions of each marketing and sales activity that yield the best correlation coefficients, and view the data graphically. Regressions will further clarify the strength of the relationships.
Finally, you can combine these elements and others (e.g. prices, technological change, competition, seasonal factors, etc.) into a statistical model that explains most of the variation in your business activity historically. You can calculate impacts, and you can make better decisions about next best activities to boost your pipeline opportunities, bookings or revenue. These topics will be addressed in future blog posts.
Editor’s note: For more information about planning considerations for B2B sales, marketing and product leaders, download SiriusDecisions’ 2017 Planning Assumptions Guides.