Bad Economy? Bad Markets? Use Statistical Analyses to Inform Your Next Moves, Part 2
- While economic and market conditions explain most of the changes in your business, your marketing and sales activities help you perform better than the market
- As noted in my previous blog post, compile the data and use Excel to check correlations
- You will learn which of your marketing and sales activities are most closely related to changes in your business
The International Monetary Fund and the Organization for Economic Cooperation and Development have lowered their forecasts for global economic growth. The Wall Street Journal reported that third-quarter earnings are expected to fall for the sixth straight quarter. As the economy slows, so does business spending. Sooner or later, that affects you, too.
Now is the time to deploy your best marketing and sales weapons, use them in the right combination, and use them at the right time. Of course, that assumes that you know which of your marketing tactics and sales activities are the most impactful. Do you know which ones generate the most leads, pipeline opportunities and sales? It also assumes that you know which ones should be used for big companies, small companies, manufacturers, banks, retailers, professional services companies and others. Are you able to distinguish the needs and responses across different segments of your business?
If you haven’t done the statistical analysis to quantify the relationships between your marketing and sales activities and positive business outcomes, then you don’t really know the right tactics, the right mix or the right timing. You could guess or rely on anecdotal information based on a few favorable examples, but you could be wrong and wind up wasting precious time, money and resources.
It’s time to stop guessing and start knowing. After you have analyzed the effect of economic and market conditions on your business (see my previous blog post for a few more details about this) you should analyze the effects that your marketing tactics and sales activities have on your business.
- Compile data on your pipeline opportunities, bookings or revenue from internal sources. Three or four years of monthly data will be needed.
- Compile data from your marketing, sales, and finance departments on your marketing and sales activities. Three or four years of monthly data will be needed.
- Put the data in Excel columns, and create “lagged” versions of the market data.
- Check the correlations between changes in your business metrics and changes in current and lagged versions of your marketing and sales activities. You can generate bivariate correlations in Excel.
- Select the factors and the lags with the highest correlations, and proceed from there with multivariate regressions.
- You can visually inspect the results and prepare materials for internal reports and presentations.
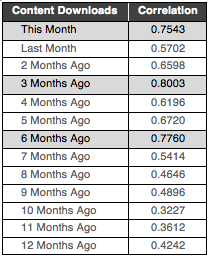
The data in the table exemplify the results generated by Excel. In this case, the number of downloads of a particular marketing asset is compared to the value of bookings over the last three years. The correlation coefficients indicate that the number of downloads in the current month is highly correlated with the value of bookings in the current month. They also indicate that the number of downloads three and six months ago is even more highly correlated with the value of bookings in the current month. This means that your customers and prospects start evaluating prospective purchases several months before making a purchase. It also means that you need to put your best foot forward long before you hope to close sales.
You can generate similar insights for other marketing and sales activities including:
- Digital activity on your Web site (sessions, page views, users, duration, downloads of relevant content, tools, trials)
- Email activity (sent, opened, viewed, clicked through)
- Other marketing tactics (teleprospecting, events)
- Sales activities (email contacts, telephone calls, in-person meetings)
The analysis can quantify the relationships in total and by segment (e.g. business sizes, industries, geographic areas, functions). Armed with this knowledge, you can begin to statistically test combinations of marketing tactics and sales activities and iterate toward the best mix for each group of customers and prospects. My next post will discuss using regression analysis to do this.