Bad Economy? Bad Markets? Use Statistical Analyses to Inform Your Next Moves, Part 3
- Many factors affect your business – economic and market conditions, prices, marketing tactics, sales activities, technology trends
- Comprehensive and objective statistical analyses clarify the importance and timing of each business driver
- Translate the statistical results into impacts on your pipeline inflow and bookings, and then use simulations to optimize the marketing mix
Legendary investor Warren Buffet once said, “You are neither right nor wrong because the crowd [agrees or] disagrees with you. You are right because your data and reasoning are right.” This statement summarizes the value of analytics to executives, managers and planners who succeed in compiling, mining and exploiting insights buried in their data.
My colleague Kerry Cunningham often cites Professor Richard Feynman’s first principle of research, “The first principle is that you must not fool yourself, and you are the easiest person to fool.” This statement summarizes an approach to analytics that must be comprehensive and objective.
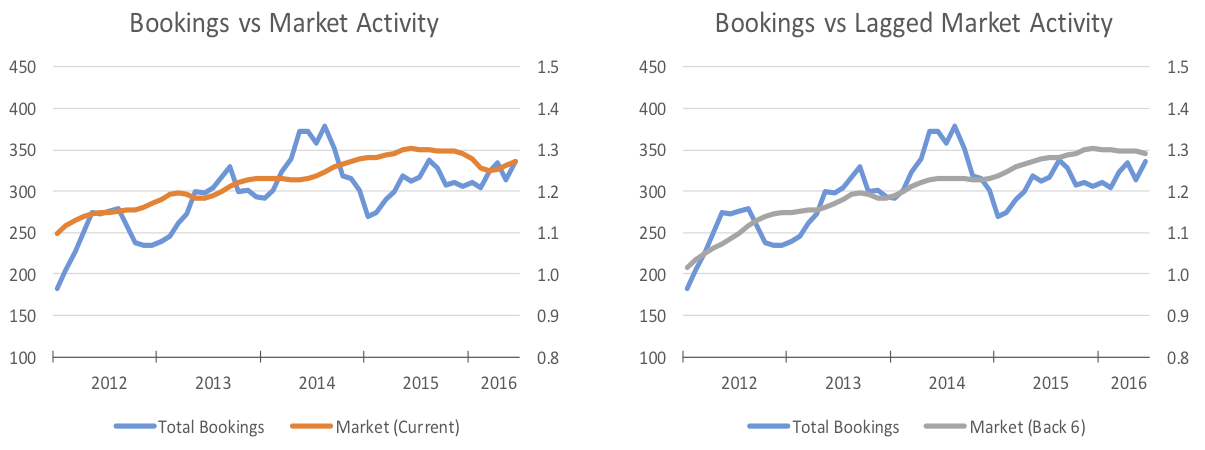
With these thoughts in mind, let’s review the first two parts of this series of blog posts. In part 1, I identified external economic and market conditions as important elements that drive pipeline inflow and bookings. You must quantify the relationship to learn how much of your business is driven by factors beyond your control. You will probably find that, like most businesses, external factors drive more than half of your business.
In part 2, the factors that you control – your marketing and sales activities – also affect your business performance. You must quantify these relationships to learn which marketing and sales tactics and activities are significant drivers of your business, the timing of the relationships and the combinations of factors that drive significant portions of your business.
A thorough analysis of your pipeline inflow or bookings relative to external and internal factors yields a statistical representation of your business that looks something like this:
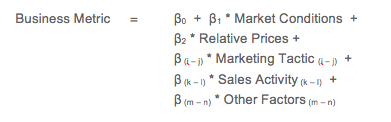
If you compile the right data and use the right statistical methods, you will find that multiple factors over the last six months combine to explain your pipeline inflow and bookings. It’s not just one factor (e.g. first touch or last touch), and it’s not just activities and touches that you have engaged in during the most recent few weeks. It’s a combination of touches that have occurred at different times over the course of a typical three-month to six-month buyer’s journey. Moreover, the specific factors, their significance and their timing vary by market segment. The better you understand this and the more relevant your communications are for each segment, the more potent your marketing and sales activities will be and the better you will perform under all market conditions.
The estimated coefficients (i.e. the betas in the generic formula shown above) can be translated into a simulation model that yields better insights about the factors that drive your business. For example, the chart shows the impacts that the major drivers – market conditions, relative prices, marketing and sales activities – have on total bookings. Notice that this company’s marketing and sales activities account for 22 percent of total bookings. The chart also lists the key marketing and sales drivers that are included in the model. The numbers in parentheses sum to 24 percent, indicating that these marketing and sales drivers account for all of the marketing and sales contribution to the business.
Once we have structured the percentage impacts into a simulation tool, we can test different allocations of the marketing budget and quantify the impact on pipeline inflow and bookings. For example, if we increase spending on teleprospecting by $100,000, the simulation model indicates that bookings will rise by $11 million. But if we increase spending on email, bookings will rise by $12 million. We can easily run multiple simulations to test all of the marketing and sales activities – individually and collectively – included in the model. We can also test the impacts of changes in external market conditions and prices.
Detailed data, useful analyses and careful interpretations can guide you toward a more impactful mix of marketing and sales activities. The insights derived from this process will help you perform better than the market – whether it’s going up or down. If you can do that, then you will gain market share at the expense of your competitors.