Common Total Economic Impact™ (TEI) ROI Modeling Questions Answered
“How would you quantify these benefits?”
I hear this question often from clients when kicking off a Total Economic Impact™ (TEI) project. Stakeholders are typically familiar with building a business case and recognize the challenges associated with constructing financial models (e.g., avoiding mathematical errors, reader comprehension). Given the variety of use cases and benefits being quantified, clients want assurance that Forrester’s TEI approach to financial modeling is sound. What’s more, the model needs to be easy to understand, as they often want assistance with coherently translating the value of benefits to prospective customers.
We’ve previously covered on the Forrester blog how TEI studies help share the investment story around tech solutions. Instrumental to telling that story are the financial models our consultants create, which illustrate how we quantify the benefits.
Below are a few common questions that we hear from clients around constructing financial models and common ways in how we approach modeling them. Keep in mind that there isn’t one “correct” way to build financial models — but a model that clearly communicates findings is most helpful for readers.
Financial Model Question Examples
Conversion Rates
Question #1: How do you highlight the benefits in a financial model?
Example benefit: Improved conversion rates
Answer: Conveying the value of strong conversion rates is rather straightforward: The number of converted customers multiplied by their associated value produces a financial result. While that outcome may make compelling cases to customers, the conversion rate as a called-out number may not speak strongly for itself.
In our TEI studies, we often include a line item referencing percentage gains to underscore the improvements made with the solution.
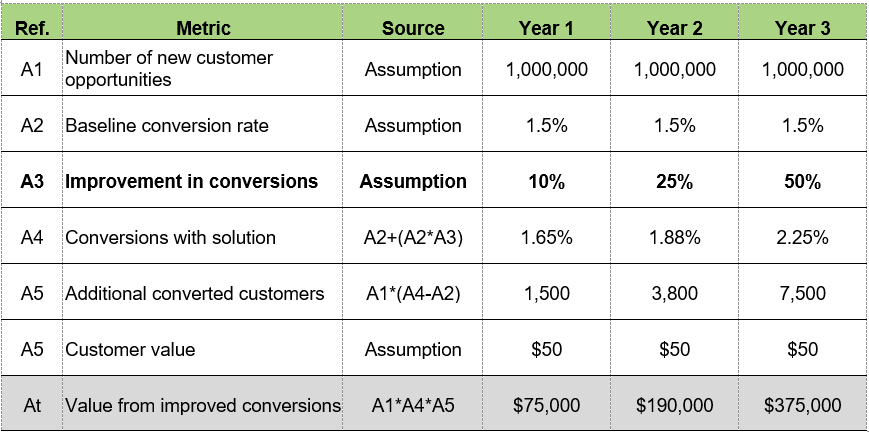
Beyond the called-out numbers, narratives around financial model tables help to cover more “soft” metrics or benefits that are qualitative. For example, clients often ask about measuring the impact that their solution has on improving customer experience (CX). While approaches for quantifying stronger CX can be explored, more often that benefit is rolled into the narrative of explaining gains in conversion rates to make a more compelling story.
Question #2: How do you avoid double-counting values?
Example benefit: Growth in customer value
Answer: Multiple benefits can be tied to a customer base (e.g., growth in leads, speed-to-value, the benefits in this blog post, etc.) and result in double-counting if one isn’t careful. Falling into this trap can result in head-scratching among decision-makers reviewing the results.
With TEI studies, we often scaffold our financial tables and build upon each one to delineate how each benefit drives value. For the benefit of growth in customer value, where we calculate additional value generated per conversion from customers, we separate additional value realized to avoid double-counting the value represented in Benefit A. We accomplish that here by subtracting line B2 from line B4 when calculating the final number in line Bt — essentially, it’s the number of customers multiplied by $.
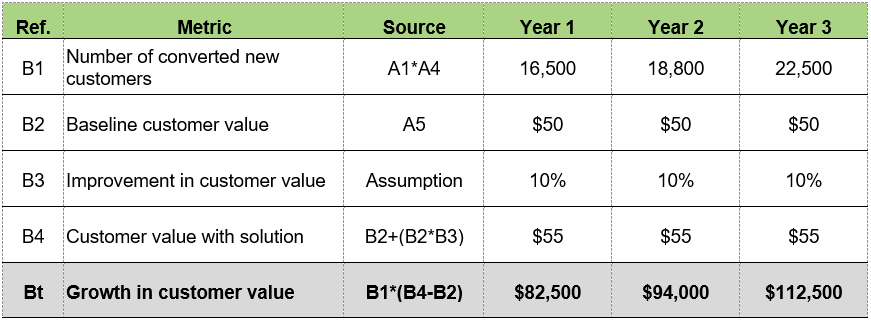
If double-counting is caught at a later stage, it can result in a domino effect of changes to the model to course-correct the analysis. To keep results in line with the level of investment customers make, it is critical to parse out the value for each benefit.
Question #3: How do you determine the lifetime value generated by a retained customer?
Example benefit: Customer retention rate
Answer: We assume that a customer is one that makes purchases or spends money with a business each year throughout the analysis. Thus, for each customer retained, we calculate the value they would generate for each year of analysis. Note in the table below (line C4) how customers retained each year are added to the following year.
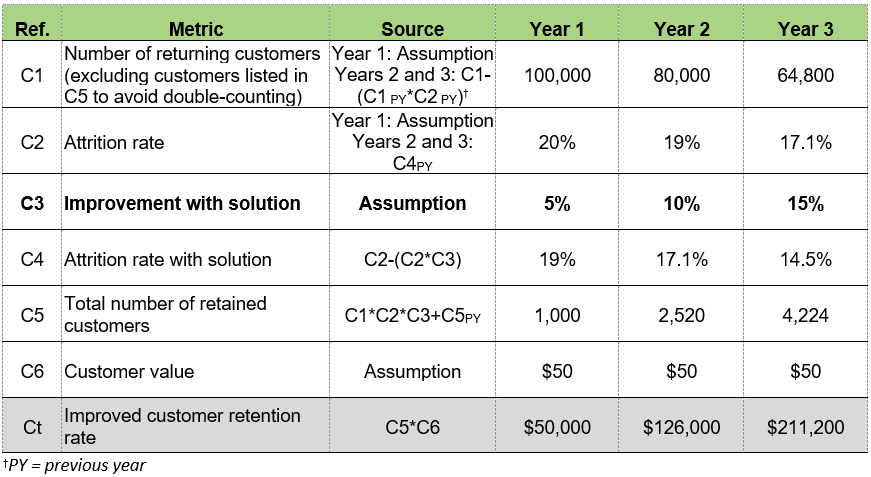
In TEI studies, we estimate the financial return of a three-year investment in a solution; this timeline caps the period of time for value that retained customers generate. Estimates of customer value beyond this time frame can produce potentially outsized estimates in value relative to costs. If customers are estimated to churn in less than three years, we will build that into calculation conditions so they don’t generate value for each of the three years.
Calculations for improved customer retention rate can get complicated, as shown in the table. This is where calling out improvement in bold helps to tell the story that readers should focus on. To prevent further complications, this table draws from a different pool of customers (returning customers instead of new customers) and doesn’t scaffold on the previous tables. If necessary, the pool of customers can be pulled into analysis here.
These are only a few inquiries that we receive, but they are indicative of the approach our consultants take to build financial models and quantify benefits. Before companies embark on a TEI study, I encourage stakeholders to outline any questions they have about the process and identify benefits they would like to see quantified. The earlier those conversations happen, the more prepared team members are when creating the business case.
If you are interested in starting those conversations, learning more about our TEI studies, or need help developing a business case for one, please contact Forrester Consulting’s TEI team at teiconsulting@forrester.com.
Categories