What Fitbit™ Can Teach Us About Sales Analytics
- Well-executed sales measurement programs can instantly boost sales productivity
- Gamification makes analytics much more interesting and impactful for users, and increases their engagement
- Sales operations should stop presenting metrics and start presenting answers
Between 1920 and 1924, now-defunct electrical engineering and manufacturing company Western Electric conducted an experiment to test how lighting changes affected productivity by observing a group of employees at its Hawthorne Works plant in Illinois. The expectation was that brightening and dimming lighting levels would cause employees’ productivity to either increase or decrease. Much to the company’s surprise, no matter what alterations they made, the result was always the same: productivity improved! Just as surprising was the additional discovery that when the experiment ended and observations stopped, productivity dropped back down to original levels. Today, this is known as the Hawthorne effect: When people know they are being observed, they perform better.
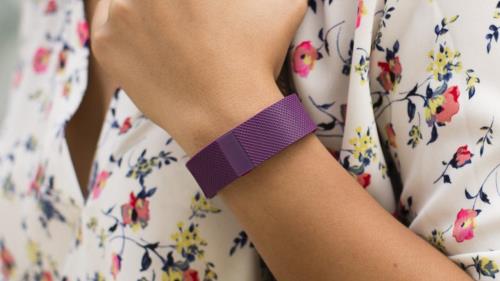
The Hawthorne effect is largely credited for the success of wearable health monitors and step-trackers from companies like Fitbit. These trackers have been proven to improve users’ fitness levels while helping them lose weight. According to Fitbit’s research, users take 43 percent more steps than non-users. Why? One reason is that Fitbit holds its wearers accountable to themselves and others. They know their activity is being tracked because they see evidence of it by checking their personal dashboards. Has anyone ever walked laps before bed to get their required steps in? Who would know if you missed? Your super-competitive sister tracking you on the Fitbit leaderboard? The one who would taunt you endlessly using Fitbit’s gamified taunt feature?
In addition to holding users accountable to themselves and others, Fitbit modifies wearers’ behaviors by conditioning them to correlate outcomes with actions. Users can achieve a goal and see immediate feedback on dashboards. Dashboard achievements correspond with weight loss and feelings of improved health. Finally, users earn additional reinforcement through a visualized and gamified experience that features leaderboards, badges and challenges. It’s a winning formula, and it takes something that’s boring and repetitive (even for people who love to do it) and makes it much more fun.
We can apply the same principle to sales! Fitbit has done what sales operations has tried to do for years. The company has made reporting interesting, engaging, actionable and fun. By providing users with analytics and empowering them with information, fitness tracker companies have helped them modify their behaviors and achieve real results. Reporting is simple, accurate, relevant, visually stimulating and real-time. It has drill-down capability and, best of all, it’s made self-reporting unnecessary. And let’s not forget: it’s also mobile.
So for those of us in sales operations, what we really need to do is build something like a Salesbit (though we can’t call it that because somebody’s already trademarked the term). Let’s start by narrowing down and improving the dashboards we already produce, and let’s arm reps with the critical information they need to gauge their own performance. Let’s also stop making reporting boring. We should make dashboards visually stimulating to really engage reps.
Let’s scrap the hundreds of dashboards and canned reports that have accumulated over the years in our sales force automation (SFA) systems. No one is looking at them anyway. Put an end to those dreaded multi-tabbed, color-coded monstrous Excel workbooks that we post to abandoned shared drives and send to clog people’s email.
To re-engineer reporting, let’s stop focusing on individual metrics and KPIs – and start focusing on answering sales’ questions, the same way Fitbit answers its users’ main question: “How am I doing?” Sales’ most pressing question is “How am I doing against my number?” That’s easy to answer. Just show them (but remember to make it visually stimulating and intuitive):
1. Sales quota
- Commit to quota (percentage)
- Year-to-date sales results against quota (percentage)
2. Amount left to close (to go)
- Against quota
- Against commit
3. Funnel coverage ratios compared to “to go”
- Total funnel vs. to go
- Committed funnel vs. to go
- Highest sales stage before closed vs. to go
- Two highest stages before closed vs. to go
4. Basic trending
- Quarter-over-quarter sales growth (as of same day this quarter compared to same day last quarter)
- Year-over-year sales growth (as of same day this year compared to same day last year)
This is not going to be as simple as rewriting your reports in your SFA system. There are some investments you are going to need to make:
1. Buy an advanced analytics and forecasting solution:
- Standard SFA functionality doesn’t snapshot data, and it won’t let you present comparative trending analysis. We should only present metrics that show performance relative to a target, peer performance and a comparative trend. This allows users to gauge their performance and modify their behavior.
- Standard SFA forecast functionality has not kept pace with the complexity of forecasting. Forecasting should be a seamless exercise that promotes personal and digital communication while providing robust predictive analytics. You need a specialized forecasting tool to achieve this.
- Advanced reporting tools make dashboarding simple, accurate, relevant, visually stimulating, real-time, and available for drilling down – and there is no self-reporting! These are all the things that Fitbit is.
2. Gamify the experience:
- It’s more fun and engaging.
- It reinforces the Hawthorne effect.
3. Focus on answering next-level sales questions:
- “What am I currently doing that’s contributing to my success or failure?”
- “What could I be doing better, and how will those changes affect my performance in the future?”
How will you get funding to finally make reporting what it should be? There’s proof that great reporting and observation improves productivity. Western Electric demonstrated it in 1924, and wearable fitness companies prove it again every day. Take a conservative estimate and say that sales results will improve by 2 percent (I’m sure it will be more, because I’ve experienced it myself)… and that 2 percent improvement will more than cover the costs!