What Drives Your Business?
- Predictive modeling can identify and quantify the factors that drive or support pipeline opportunities, bookings, revenues and/or profits
- For example, market conditions account for 50 percent to 70 percent of business activity for most companies
- Leverage predictive analytics to figure out what drives your business, and how to make better decisions about the factors you control
Just about everyone believes their marketing and sales efforts affect the success of their businesses. If you make this bold statement at your next business lunch meeting, people might respond like you’ve stated the obvious. But do you know how much it actually matters? If you look at your existing data, it’s not that difficult to figure out.
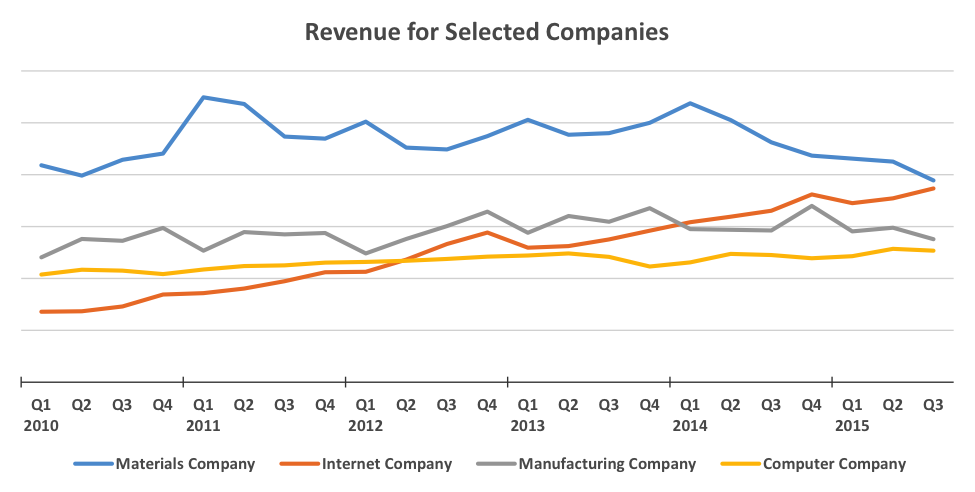
The chart below depicts revenue activity for four very different B2B businesses – industrial materials, Internet publishing, heavy manufacturing and computer manufacturing. There are obvious differences, but they all have one thing in common: Market activity – i.e. the way their customers behave individually and collectively – drives most of their pipeline opportunities, bookings, revenues and profits. This is true for almost all businesses, including yours. But other factors drive the rest – competition, technological change, prices, sales, marketing and seasonal factors – to name a few.
You probably already have access to most of the data required to delve into the inner workings of your business:
- Pipeline opportunities, bookings, revenues, profits
- Average selling prices and/or average contract values
- Industry price indexes and inflation indexes
- Digital activity (e.g. sessions, page views, users, duration, downloads of key relevant content, tools, trials)
- Email activity (e.g. sent, opened, viewed, clicked-through)
- Other marketing tactics (e.g. teleprospecting, events)
- Sales activities
- Economic and market conditions
- Competitor or industry-wide activity
- Technological change indexes
- Seasonal factors
These data inputs could be viewed in total, by product, by industry segment, by size segment, by territory and/or by customer. They can be combined in statistical analysis processes to quantify relationships that exist among the various data elements. Most notably, predictive modeling can identify and quantify the factors that drive or support pipeline opportunities, bookings, revenues and/or profits.
If that seems too complicated, here is a starting point. SiriusDecisions analyzed these dimensions across multiple organizations and industries within our client base. Here is what we found:
- For most companies, market conditions account for 50 to 75 percent of business activity. This is true whether markets are rising, falling or stagnant. The percentage varies by industry and by company within an industry. Very few companies can control the market, but all companies should acknowledge, understand, quantify and appreciate its contribution.
- Relative prices typically account for 10 to 20 percent of business activity. Companies that operate more efficiently can more easily change prices to affect their results. Others must simply follow prices set by the competition and hope for the best.
- Marketing tactics and sales activities typically account for 10 to 30 percent of business activity. This percentage usually can be allocated to a variety of marketing tactics and sales activities. In some cases, it’s all about Web site activity and well-coordinated inside and outside sales followup. In other cases, sales takes the lead, while marketing activities (virtual and real) and teleprospecting complete the customer and prospect relationship ecosystem. In all cases, success requires a blend of well-aligned tactics. The companies that do it best go on to increase their market share.
- Moreover, some of the factors that drive or influence business activity do so over time, rather than immediately. Changes in factors that occurred some weeks or months ago are related to pipeline opportunities, bookings, revenues and profits that occur this week or month. In that respect, some of the factors provide a leading indication of business activity over the next few months. The lag structure and the predictive model can be used to simulate the impacts that changes in selected factors would have on business activity. Then the marketing mix can be adjusted and optimized to fine-tune business performance.
As you enter into 2016, it’s now time to use predictive analytics to figure out what drives your business. You already have most or all of the data. The analytical tools and techniques are time-tested and readily available. The results are key to generating insights and making better decisions about the factors that you control. To learn more about this topic and how you can get your own custom analysis, contact SiriusDecisions.