Among Large Tech Vendors, Microsoft Does The Worst Job Of Reporting Its Revenues
To keep track of what’s happening to the tech market, I collect quarterly data on the revenues from more than 70 large IT vendors. Accordingly, I spend an unhealthy amount of time looking at their quarterly earnings releases, analyst presentations, and 10-Q and 10-K reports — making me something of a connoisseur of vendor earnings releases, at least from the perspective of revenues and their breakdown by products and geographies.
From that perspective, Microsoft wins the prize for the most opaque earnings release. First, 2003 was the last time it provided its revenues by geography and its revenues from sales to original equipment manufacturers. Since then, there’s been no data or even guidance on its geographic revenues. Second, it does not break out sales to consumers from sales to business and government, although it does report the growth rates in its sales of Office and its other information worker products to consumers or to enterprises. Third, about every year or so, it re-juggles its product line revenues, shifting product revenues into or out of different product lines. While it generally restates the revenues for the prior eight quarters to bring them into line with its new business unit categories, it doesn’t provide guidance or data on prior years, making comparisons with past years very challenging.
I considered ranking other vendors on the transparency of their earnings releases. But I decided it would be more useful to describe the kind of data that I as a technology analyst — and other vendor strategists analyzing the tech market — would like to get from vendor earnings releases.
- Break out consumer sales from business or enterprise sales. The consumer market and enterprise market are very different, with different economics, sales models, and dynamics; it’s important to understand how much of a vendor’s revenues are coming from consumers versus enterprises. Vendors like Symantec and Dell make it easy, reporting consumer sales as a distinct business. HP provides breakdowns of its printer and PC sales between consumers and business. But Cisco Systems, despite its acquisitions of consumer businesses like the Flip Video camera, does not report its consumer revenues. And consumer-focused tech vendors like Apple or Amazon.com do not report their enterprise or business revenues, even those these are starting to become meaningful numbers.
- Provide data on revenues by geographic market. As developed markets mature (and the US diverges from Europe and Japan) and emerging markets become the big growth areas, it is critical to understand where a vendor’s revenues are coming from. Other vendors that have gone Microsoft’s route and stopped reporting geographic revenues include Cisco (although it does provide growth rates) and BMC Software (BMC shifted from providing revenues for major geographies to US versus international). Motorola at the other extreme now provides geographic revenue breakouts for each of its three business units (mobile devices, home, and enterprise mobility). SAP also does a good job of reporting its revenues at both regional and large country levels.
- Provide more detailed and time-consistent data on products. As vendors grow and diversify through acquisitions, product revenues that were once clear when the acquired vendor was independent tend to be lost in the acquiring vendors’ product categories. EMC is better than most of the larger vendors, with product and services revenues broken out for its main product lines (although storage hardware and storage software revenues are lumped together). Communications equipment vendors like Ericsson, Alcatel-Lucent, and Motorola also provide detailed product revenues, as do IT services vendors like Accenture, Capgemini, Wipro, Infosys, and Tata Consultancy Services (TCS). While IBM does not provide quarterly revenue numbers for its major hardware and software products, it at least provides quarterly growth rates for these product lines, as well as data for its different IT services businesses. Dell and HP have reasonable detail on their product revenues — for example, breaking out desktop, laptop, server, storage, and peripherals revenues. But Oracle, despite multiple acquisitions, only reports revenues for three product lines: hardware (after the Sun Microsystems acquisition), middleware, and apps. SAP, which once provided data on license revenues for its main product lines, now only reports revenues for all software combined. Lastly, Microsoft, as noted, buckets its many products into just five major categories, with periodic changes in which products it puts into different categories. Japanese vendors like Fujitsu, Hitachi, and NEC are almost as bad, using a limited number of hard-to-understand and often-changing product categories for their diverse offerings.
These comments on the degree of disclosure that various vendors provide about their sources of revenues by products, by geography, and by consumer vs. business could be seen as just the grumbling of one analyst who is trying to make sense of vendor revenues. As such, they are likely to be ignored – especially by management that may be concerned that disclosing this level of detail would provide valuable information to competitors. However, vendors should remember that investors in their stock are probably looking for similar levels of information as I am seeking.
To test this thesis, I did a simple statistical test. Using a 1-5 scale, I rated 20 leading tech vendors – Apple, BMC, Cisco Systems, Cognizant, Dell, EMC, Ericsson, Fujitsu, Hitachi, HP, IBM, Infosys, Microsoft, Motorola, Oracle, SAP, Symantec, Tata Consultancy, Unisys, and Wipro – on the clarity and completeness of their disclosure of revenues by geography, by product or service line, and by consumer vs. business where that applied. I then compared these ratings with their price-to-earnings (P/E) ratio as of December 29 (as disclosed on Yahoo! Finance). The result was a small but statistically significant correlation between our revenue disclosure rating and the vendor's P/E ratio – vendors who provided more disclosure of their sources of revenues tended to have higher P/E ratios (see Figure 1).
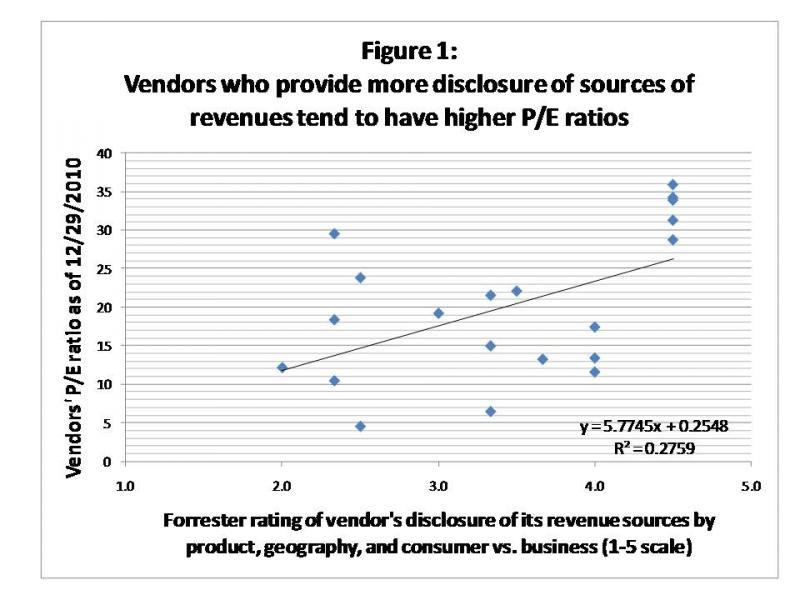
I wouldn’t make too much of this correlation. The sample group is relatively small, and the R-squared of .2759 is not strong. Still, given all the other factors that impact a company’s profits and its stock price, it is surprising that there is any correlation between revenue disclosure and P/E ratios. So, I would argue that it is not only helpful to analysts for vendors to provide clear disclosure of the geographic, product, and customer sources of their revenues, such disclosure can't hurt their stock price, and may even help it a little.
Categories