Use Your Data to Learn About Buying Process Timing
- The buying process takes time – which means that customers and prospects start compiling information months before making a purchase decision
- Your data reveals how and when customers and prospects interact with you
- Using predictive analytics, you can learn about the sequence of events that yields leads, pipeline opportunities and bookings
SiriusDecisions’ survey of B2B buyers indicates that 50 percent to 60 percent of purchases involve consensus or committee decisions. For consensus buying, 54 percent of buying processes take three to six months, and 6 percent take longer than that. For committee buying, 60 percent of buying processes take three to six months, and 20 percent take longer than that.
Even when an individual makes the buying decision for a much smaller purchase, 32 percent of buying processes takes three to six months. For each of these buying scenarios, buyers compile information as they work their way through the education, solution and selection phases of the buying process. Some of the information is gathered from your Web site, account managers, product managers, sales reps, product engineers and others.
You can compile and analyze internal and external data to learn what the buyers are doing with their time, how they respond to each factor in the decisionmaking process, and at what point in the buying process each factor affects the ultimate decision. Some of the data include:
- Digital activity on your Web site (sessions, page views, users, duration, downloads of content, tools and trials)
- Email activity (sent, opened, viewed, clicked-through)
- Other marketing tactics (teleprospecting, live and virtual events, customer advocacy)
- Sales activities (email contacts, telephone calls, in-person meetings)
- Average selling prices and average contract values
- Economic and market conditions
- Industry prices and broad inflation indexes
With different views of the data and the right analysis, you can answer questions such as:
- How do our marketing and sales activities affect our leads, pipeline and bookings?
- Which tactics and interactions are the most impactful?
- How do external market conditions and industry prices affect our business?
- What are the timing and sequence of interactions and influences that affect the buying decision?
With bivariate correlations and multivariate linear regressions, you can measure the relationships between your pipeline opportunities or your bookings and all of the factors listed above as well as others. Just be sure that you test several versions of each factor. Specifically, you probably believe that the things you do, the things your customers do, the things your prospects do and changes in the economy this month affect your business this month. That’s probably true, at least to some extent. However, it is probably more likely that things that were done or happened months ago are more impactful on this month’s business performance.
To test this, lag each factor from one to nine months and include these nine versions of each factor in your analysis. This greatly expands the analysis and enhances the insights that can be generated. Thus, if you have 100 factors to test, creating nine lagged versions of each factor will yield 1,000 factors to test (i.e. 100 x (1 9)).
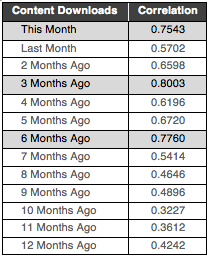
The data in the table exemplify three versions of the same data for two different factors. The first version represents current values for each of the last 12 months. The second version represents the same data that have been lagged three months. The third version represents the same data that have been lagged six months.
In many analyses that I have done for different clients in different industries, emails that have been sent and clicked through to the company’s Web site often help drive business three to six months later. Similarly, changes in market conditions that happened three to six months ago affect business activity in the current month. This type of analysis not only tells you the timing of each factor that drives your pipeline or bookings, but also decodes the sequence of many factors that contribute to buying decisions (because different factors can have different lags) and identifies leading indicators for your business. As shown in the table, current data for each factor is only available through September 2016. But with a lagged version of the current data has the strongest relationship, you have a near-term forecast of that factor. In the examples shown, the lagged versions of each factor are leading indicators of part of your business and yield forecasts through December 2016 and March 2017.
Finally, organize your internal and external data. Create lagged versions of each factor that can affect your business. Import the data into your favorite statistical analysis software. Complete hundreds or thousands of correlations and dozens or hundreds of regressions to quantify the strength of business drivers, identify the relevant timing of buyer interactions, create leading indicators where possible, and deliver insights to stakeholders throughout your organization.