How Does Your Brand Stack Up On Facebook, Twitter, And Instagram?
Ever wonder how you compare to the top brands in your use of Facebook, Twitter, and other social networks?
Forrester recently reviewed how the top 50 global brands market on social networks. We evaluated 11.8 million user interactions on 2,489 posts made by 249 branded profiles, and collected tons of great data — including how many top brands use each social network, how many fans they’ve collected, how often they post, and how often users interact with their posts. We published our complete findings in our research brief “How Top Brands Are Using Facebook, Twitter, And Instagram” — but I also wanted to highlight some key findings here.
First, follower counts for the big global brands have skyrocketed in the past year. Top brands now average 18.1 million Facebook fans each — more than double their average in 2014. Their average number of Instagram followers is now over 1 million — almost five times higher than last year. Follower counts have nearly doubled on Twitter and Google+ as well.
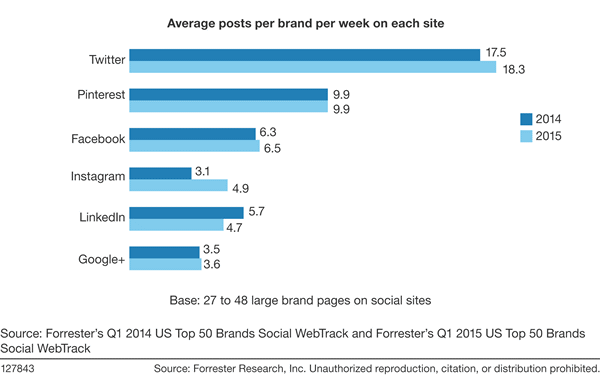
Second, marketers are posting more often than in pervious years. Top brands now post 18.3 times per week on Twitter and 6.5 times per week on Facebook — both slight increases over 2014. They post 4.9 times per week on Instagram, an increase of more than 50% over last year.

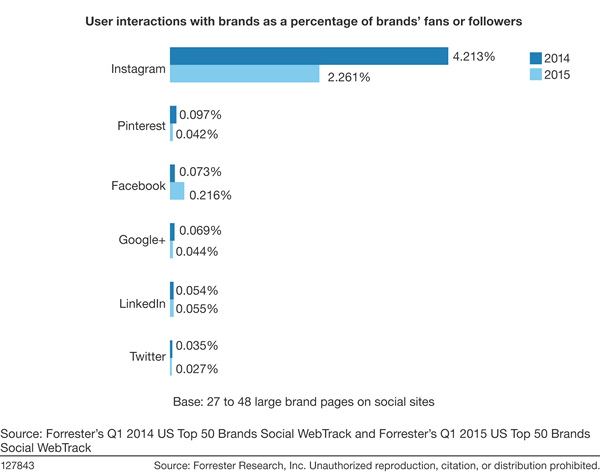
Finally, already-low user interaction rates continue to fall on most social sites. Yes, Instagram is still the king of social engagement — but its per-follower interaction rate of 2.3% is barely half what it was in 2014. Per-follower engagement rates on Pinterest, Google+, and Twitter also all fell significantly in the past year. The only place where interaction rates went up in 2015 was Facebook; we attribute this rise to the fact that more brands are paying to promote their Facebook posts to a larger percentage of their fans.

Again, we’ve got lots more data and charts — as well as recommendations on how to act on these findings — in our report “How Top Brands Are Using Facebook, Twitter, And Instagram.“