CIOs: Understand Runaway AI Token Spend Using Rate Volume Analysis
So you’ve blown through your AI budget. Join the club. Blaming token consumption may have worked once. But as the adage goes, “Fool me once, shame on you. Fool me twice … ” you know the rest. Token consumption is a combination of multiple factors and not conclusive on its own. Hence, you need a better tool for variance analysis or you risk getting “fooled twice.”
What Drives Token Expense Variances
When it comes to analyzing variances in token spend, enterprises are trying to answer three questions: 1) What did we plan to spend? 2) What did we actually spend? and 3) What drove the difference? The answers to the first two questions are a function of: 1) the price paid per token consumed; and 2) the quantity of tokens consumed. But what many overlook is that there are numerous types of tokens, each linked to different activities and with different prices. So to answer the third question and understand the drivers of token-spending variances, enterprises must understand not only the total token consumption but also the mix of tokens being consumed and their respective price points. Without this, you’re flying blind.
Use Rate-Volume Analysis To Dig Deeper Into Variance Drivers
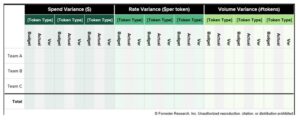
A rate-volume analysis is a great tool for getting tech leaders closer to the drivers of AI-spending variances. Start with three sections, each broken out by the type of token: 1) budget vs. actual total spend; 2) budget vs. actual average price per token; and 3) budget vs. actual volume of tokens consumed. Leaders can then apply this analysis to individuals, cost centers, projects, or any other responsibility area they want.
Different Variances Require Different Actions
By using a rate-volume analysis by token type, leaders can distinguish between types of variances and understand the corrective action suggested by each.
- Rate variance. A change in average token prices is driving the over/under in spend. Understanding where prices changed and for which tokens enables leaders to understand the activities that got more or less expensive than expected.
- Volume variance. A change in the total volume of tokens consumed is driving the over/under in spend. Understanding the category of token and the stakeholders driving the variance enables leaders to understand the activities consuming more or less than expected.
- Mix variance. If the total volume of tokens is consistent with budget but the spread across the token categories is varied, then there is a variance in the mix of tokens consumed, either by a shift away from lower-cost token categories to higher-cost token categories or vice versa. Understanding shifts in the mix enables leaders to understand drivers such as changes in the focus of AI activities over time or inefficiencies in, say, API calling or output storage.
What CIOs Should Do Next
The next steps you can take toward implementing a rate-volume analysis include the following:
- Establish the responsibility areas for where you want to drive visibility into AI spend.
- Confirm the availability of the data you need: 1) budgeted and actual total spend by token type, by responsibility area; and 2) budgeted and actual total token consumption by token type, by responsibility area. If you don’t have budgeted metrics by token type or responsibility area, then build the report based on actuals and use this as a guide for your budget (or forecast).
- Develop a PoC rate-volume dashboard in a spreadsheet or BI tool and collect feedback.
- Once you’re confident in the reliability of the data and the collection process, document the production process of the report.
If you’re struggling to explain AI-spend variances, let’s talk about how a rate-volume analysis can improve visibility and accountability. Email me at gzorella@forrester.com, connect with me on LinkedIn, or request a guidance session with me.