The Data Digest: Forrester’s Social Technographics 2016
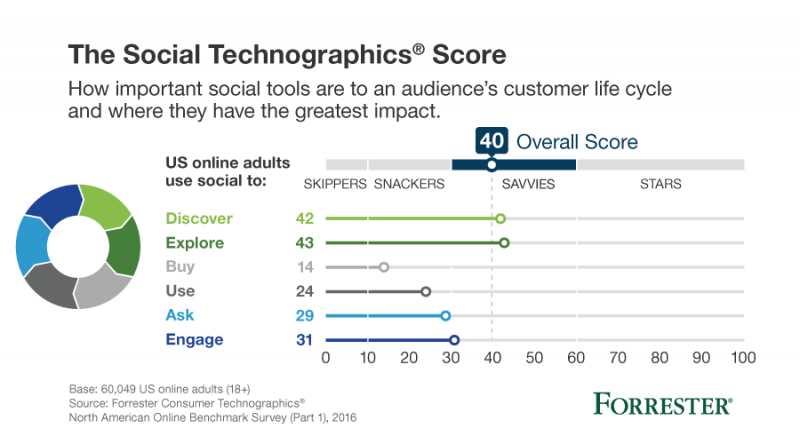
To build a successful social media program you need to understand your audience’s social media behaviors and preferences. We just released our 2016 results for Forrester's Social Technographics model, and it does just that. It shows how important social should be in your marketing plans based on how important social tools are in your customers’ life cycle. We group consumers into four groups: Social Skippers, Snackers, Savvies and Stars—the Skippers spurn commercial social interactions and the Stars demand it.
What did we find this year? In 2016, the average US online adult receives an overall score of 40 and fits into our Social Savvies category. Social Savvies consider social tools a part of their everyday lives. On average, US online adults score highly for explore and discover— they use social tools to discover new products and also to explore them when they’re considering their purchases. Compared to last year, US consumers are slightly more social media savvy in 2016: The Social Technographics Score for the average US online adult has increased from 37 in 2015 to 40 in 2016.
 Social Marketing Playbook emphasizes that social media adds value to enterprises beyond marketing—departments ranging from product development to human resources can benefit from social technologies and the collaborative, sharing mindset that comes with them. Understanding your audience’s Social Technographics score is the first step to achieving that broader benefit. Read the report to find out how.