US Consumer Spending In 2022: 10 Insights From US BEA PCE Data Analysis
Consumer spending in 2022 accounted for 68% of the US gross domestic product (GDP) — a crucial component of the US economy. Not surprisingly, consumer spending has played a key role in driving the US economic growth over the past several decades. We analyzed US consumer spending using the personal consumption expenditure (PCE) data provided by the US Bureau of Economic Analysis (BEA).
The PCE is a comprehensive measure of consumer spending. The BEA provides PCE data for a wide range of goods and services. It provides a holistic view of where US consumers spend their money. Following are 10 insights from our analysis of the PCE data from 2022 regarding US consumer spending in the following categories:
- Overall. In 2022, US consumers spent $17.4 trillion on goods and services. That spend has almost doubled in 17 years from $8.8 trillion in 2005. Spending declined only during 2009 and 2020.
- Goods vs. services. US consumers spent a total of $11.4 trillion (66% of the total) on services and $5.9 trillion (34% of the total) on goods in 2022 (see the graphic below). Other than during the 2008–2009 recession, spending on goods has grown steadily over the past two decades. Spending on services has also grown consistently, except in 2020.
- Three key essential services. US consumers spent almost $3 trillion on housing and utilities and another $2.7 trillion on healthcare services. These two categories accounted for half of services spending and one-third of total consumer spending. Financial services and insurance garnered $1.3 trillion in spending and accounted for 8% of the total.
- Three key discretionary services. US consumers spent $1.3 trillion on food services and accommodations, which accounted for 7% of total spending. They spent $615 billion (4% of the total) on recreation services and $549 billion (3% of the total) on transportation services. Consumer spending on discretionary services was significantly impacted during 2020 due to COVID-19 pandemic restrictions.
- Other services. The BEA categorizes all services that are not part of the six key service categories listed above as “other services.” US consumers spent $1.4 trillion on other services, which include communication, education, personal care, household maintenance, professional, and social services. “Other services” accounted for 8% of total spending.
- NPISH. Nonprofit institutions serving households (NPISH) are institutions that provide goods or services for free or at prices that are economically insignificant. Examples include community centers, religious institutions, sports clubs, libraries, and educational institutions. NPISH are typically funded through various means such as donations, membership fees, and government grants. Consumer spending on NPISH totaled $533 billion, accounting for 3% of total spending in 2022.
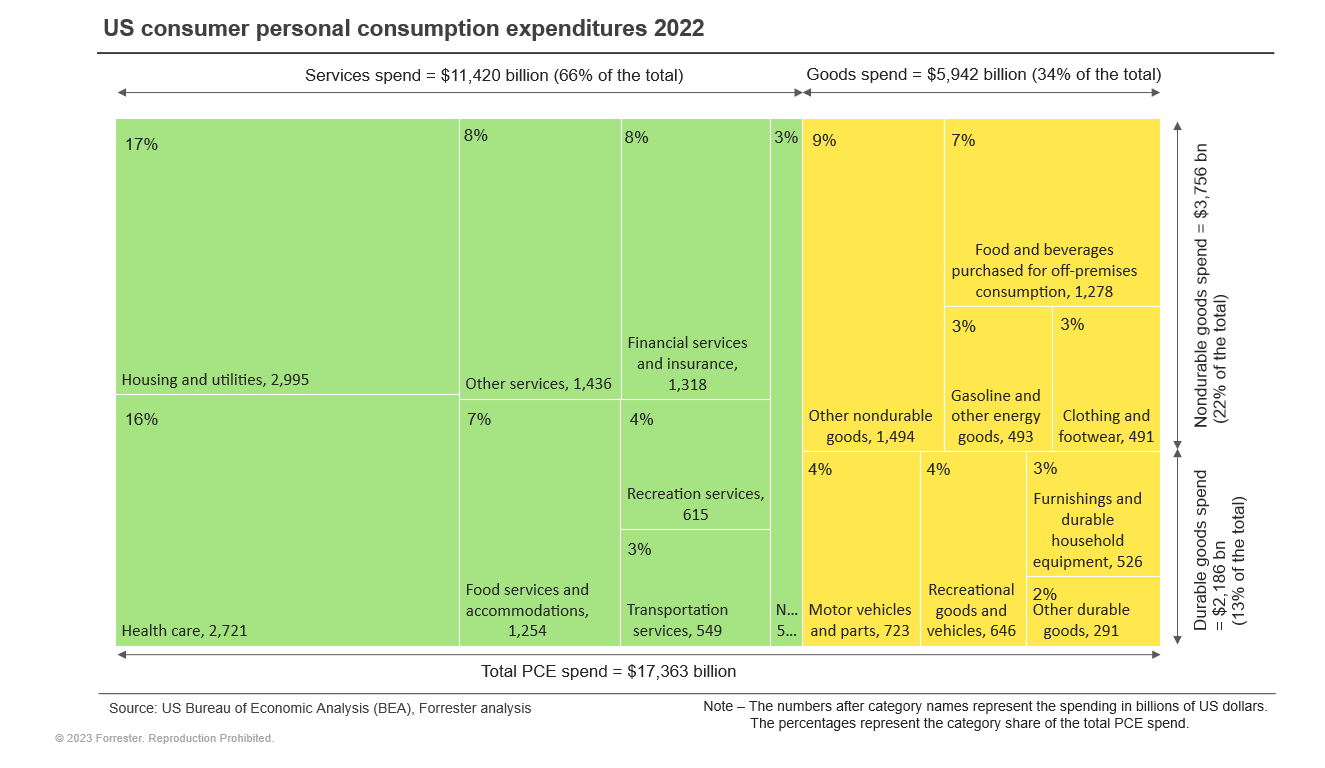
- Durable vs. nondurable goods. US consumers spent $3.8 trillion (22% of total) on nondurable goods and $2.2 trillion (13% of total) on durable goods in 2022. Durable goods are products with an expected life span of three years or more, such as automobiles, appliances, electronics, furniture, and sporting equipment. Nondurable goods, also known as soft goods, are products with an expected life span of less than three years, such as food, clothing, gasoline, household supplies, medicines, and personal care items.
- Three key nondurable good categories. In 2022, food and beverages purchased for off-premises consumption topped the list of nondurable goods, with consumers spending $1.3 trillion (7% of the total) on this category alone. US consumers spent $491 billion (3% of the total) on clothing and footwear and $493 billion (3% of the total) on gasoline and other energy goods.
- Three key durable good categories. Within durable goods, consumer spending in three key categories — motor vehicles and parts ($723 billion), furnishings and durable household equipment ($526 billion), and recreational goods and vehicles ($646 billion) — accounted for 11% of the total spending.
- Other nondurable and durable goods. The BEA categorizes all nondurable goods that are not part of the three key nondurable goods categories listed above as “other nondurable goods.” The same applies to “other durable goods.” US consumers spent $1.5 trillion (9% of the total) on other nondurable goods and $291 billion (2% of the total) on other durable goods. “Other nondurable goods” includes prescription and nonprescription drugs, games, toys, household supplies, personal care products, etc. “Other durable goods” includes categories such as jewelry, watches, luggage, therapeutic medical equipment, etc.
Please join our Forrester client webinar on US consumer spending trends and outlook on May 17, 2023. We will discuss how US consumer spending has been changing over the years and how inflation has affected consumer spending. We will also provide Forrester’s outlook on consumer spending and the implications of these trends for brands. And I’m happy to discuss these findings further with you via a guidance or inquiry session.
Related Forrester Content
Categories