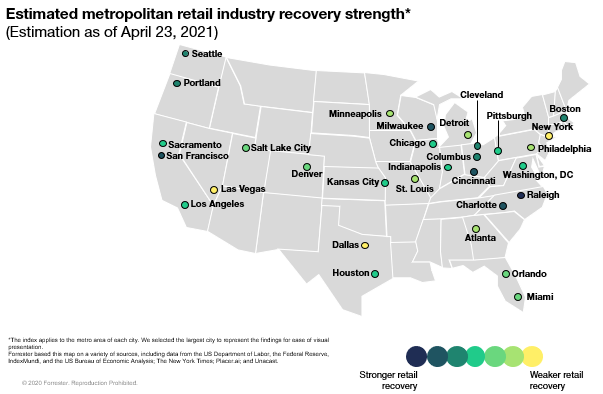
Forrester’s US Retail Recovery Heat Map, April 2021 — One Year Later
It has been one year since we began estimating how the retail economies of 30 major US metropolitan areas were recovering from COVID-19. By aggregating numerous metrics (across retail sales, local economic indicators, and virus spread), our model predicts that these metropolitan areas will face differing levels of COVID-19 disruption.
A lot has changed in a year, and last month we were excited to add a new variable to our retail recovery map: statewide vaccine rollout. As of Friday, April 23, 2021, the average rate of those who received at least one vaccine dose in the regions that we evaluate was 26%.
Over the past few weeks, we’ve seen some other promising recovery indicators. Infection rates are largely declining, many states are lessening their COVID-19 restrictions, and businesses are expanding their capacity and services.
However, some metro area retail economies are still suffering. Currently, our weakest estimated retail recoveries are in New York, Dallas, and Las Vegas. Additionally, Detroit is dealing with increasing infection rates compared with other metropolitan areas.

If you would like to see the data behind these metrics or see more metropolitan areas, please contact your Forrester account representative, schedule an inquiry with me, or email Madeline Cyr, researcher, at mcyr@forrester.com.
