Calculate The Value Your Customers Derive (And Find Critical Gaps)
Are you trying to understand how much value your customers derive from working with you?
In my research on value for customer I came across an interesting method, called Potential Gain In Customer Value (PGCV). PGCV gives you a simple way to approximate the value derived and helps prioritize initiatives. The best thing: with this recipe you can “make” this dish with data most of you already have.
Recipe For Calculating Derived Value And Value Gap
I’ll start with an image of the finished dish to inspire you. Below, find the ingredients and directions. Good luck, and let me know how your “dish” turned out.
Ingredients:
- 1 set of survey responses with ratings on how well your firm performs on CX drivers. A common question to gather this data is “Please rate how satisfied you are with the following.” You need the rating on a scale (e.g., on a 1–5, 1–7, or 1–10 scale) for each individual customer.
- 1 set of survey responses with ratings of the overall experience, satisfaction, or loyalty from the same survey participants.
Materials Needed:
- Statistical analysis tool or survey tool for doing a key driver analysis
- Spreadsheet
- Slide creation tool (optional)
Directions:
- Feed the performance ratings and the overall CX ratings into your statistical tool. Define the performance ratings as the independent variables. Define the overall CX, satisfaction, or loyalty metric as the dependent variable.
- Analyze until you identify the derived importance of each driver (i.e., the impact of each driver on overall CX, satisfaction, or loyalty).
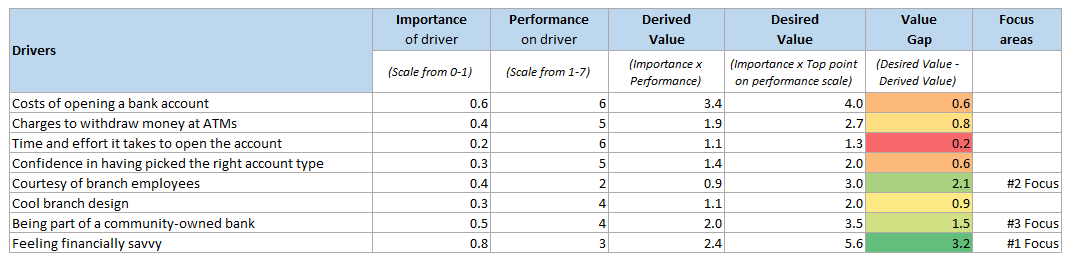
- Open a spreadsheet and create five columns: 1) Drivers; 2) Importance; 3) Performance; 4) Derived Value; 5) Desired Value; and 6) Value Gap.
- In the column “Drivers,” enter the name of all drivers, one per row.
- In the column “Importance,” enter the derived importance rating for each driver in the respective row.
- In the column “Performance,” enter the performance rating for each driver in the respective row. That is the average of the ratings each respondent has given on the performance scale for that driver.
- In the column “Derived Value,” enter a formula in each row that calculates the cell value by multiplying the Importance (column 2) and the Performance (column 3).
- Highlight these results, because they give you the value your customers currently derive on each driver.
- In the column “Desired Value,” enter a formula in each row that calculates the cell value by multiplying the Importance (column 2) with the highest possible score on the scale you used to measure Performance (that’s the top point of your scale, whether that’s a 5, 7, or 10).
- In the column “Value Gap,” enter a formula that calculates the cell value by subtracting the Derived Value (column 4) from the Desired Value (column 5).
- Highlight these results. The higher the number, the higher the value gap and the more you should focus on it.
- Share the results with stakeholders in a few punchy slides, and get some improvements going!
Variations On The Recipe For The Advanced CX Pro
How well this works depends on how well your drivers cover the different dimensions of value. Check out the report “Value For Customers: The Four Dimensions That Matter” and ask yourself whether you have drivers that represent:
- Economic value (money).
- Functional value (purpose/ease).
- Experiential value (interactions/sensations).
- Symbolic value (meaning).
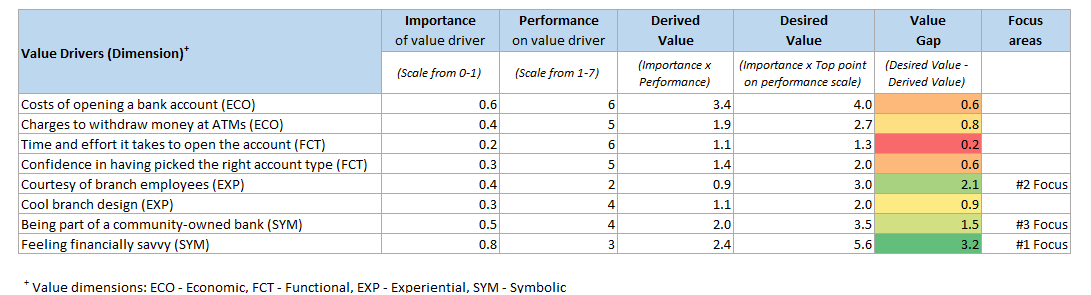
Chances are you focus on functional value. If you are not covering all dimensions, I recommend that you do some research, expand your set of drivers, and collect more data, then use those as ingredients as you follow this recipe again.
Please let me know if you want to participate in my ongoing research into measuring value for customers. And as always, please let me know what you think about this post.
Categories