The AI Bubble Isn’t Bursting Yet. Here’s What To Watch Using Our Model
“Is the AI bubble about to collapse?” You can’t open the business press this week without someone asking. Semafor says investors are getting more nervous about one, and Bloomberg has Wall Street CEOs and big money managers split on the risk. Most of what I read adds up the capital spending and stops there. That’s only half the story.
Kevin Ogunsua, Michael O’Grady, and I built the Forrester AI Bubble Model to answer the question with freely available, reliable financial data. Then we built a data pipeline that captures new filings and news reports as they come in, so we can see what’s changing between quarters. Our new report, An AI Bubble Burst Is Not Imminent, introduces the Forrester AI Bubble Model and what the audited financials told us as of October 2026. It also covers what that means for your enterprise AI strategy.
A Bubble Is Supply Built Ahead Of Demand
Our model reads two forces from public data. One force blows the bubble up, the second relieves the pressure to avoid a pop.
- Force 1: Supply pressure. This measures how far capacity building has moved from normal. It combines capital spending as a share of revenue at nine companies (the hyperscalers, Meta, CoreWeave, Oracle and the big chip suppliers) that build or supply AI compute with US investment in information-processing equipment. Supply pressure measures how far spending on the chips, data centers, and other computing infrastructure needed for AI has risen above normal levels.
- Force 2: Demand absorption. This measures how far delivered value has moved from its own normal, using those suppliers’ revenue, business investment in software, and labor productivity. Demand absorption asks whether businesses are getting enough real economic value from AI to justify how much is being invested in it.
Plot one against the other and you get four phases that run counterclockwise: Scarcity, Build-out, Demand fails, and Reset
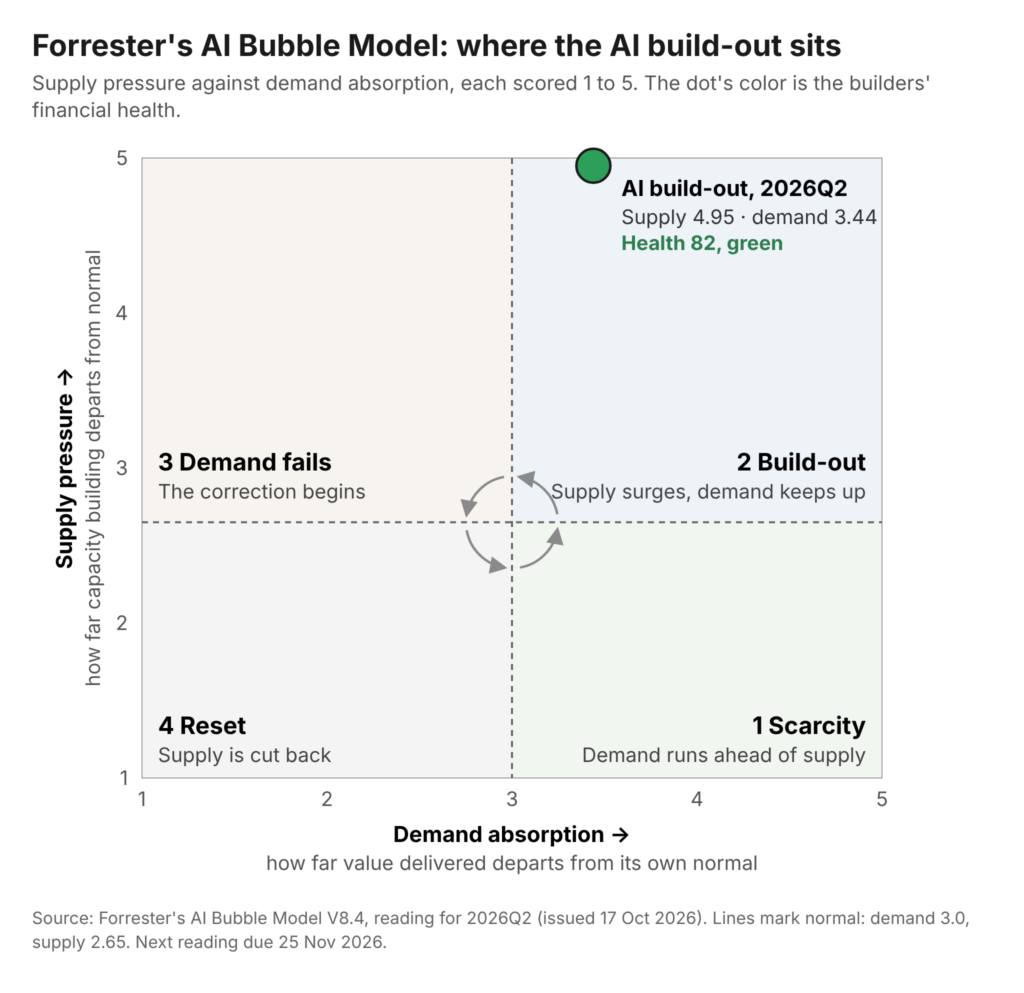
In the second quarter of 2026, supply pressure sat at 4.95, about as high as our scale goes. Demand absorption was an ordinary 3.44, a bit above the normal of 3. The model confirms the market is building capacity at an extraordinary rate for demand that so far looks mostly routine. That gap is the problem, but we all know it. The question is whether the builders of AI compute can pay for their commitments and stay healthy.
The Signal That Matters Most Is Builder Health
The dot’s color in the Forrester AI Bubble Model answers that question for now. It’s the financial health of the companies paying for the build-out, scored from six measures taken from their filings and share prices. To make sure the model holds water, we back tested it. Health turned yellow and then red before telecom and housing burst, the two past bubbles that look most like today. We also scored two sets of healthy build-outs, big tech from 2012 to 2017 and tower and data center REITs from 2010 to 2019, and they read green in 14 of 16 years.
The nine companies we track scored 82 out of 100 in the second quarter, and green starts at about 73. That’s why we say a burst is not imminent. That doesn’t mean strain isn’t showing, which it is.
Builder Health Is Still Green, But It’s Falling
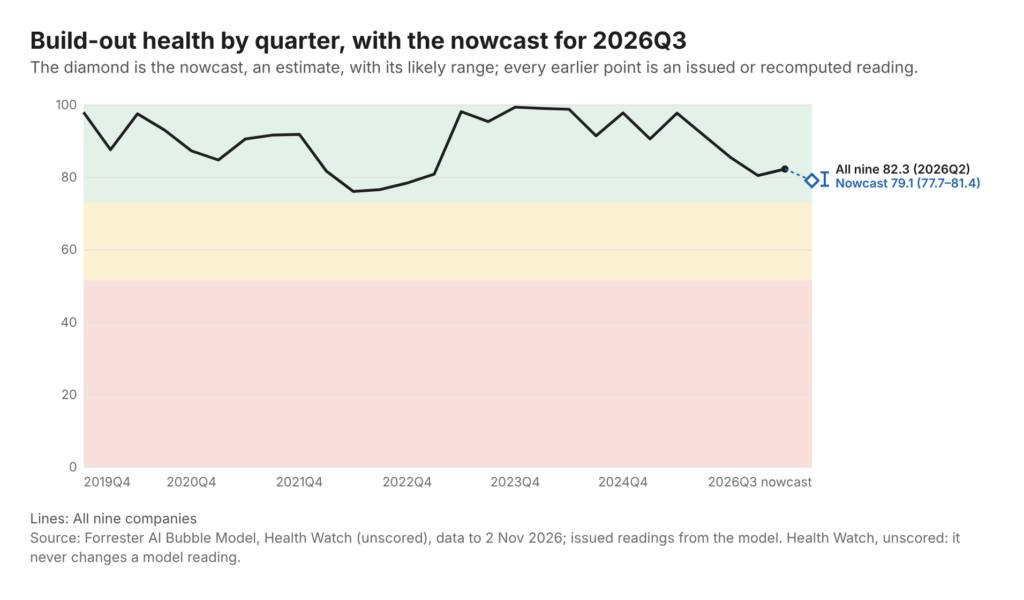
Between quarterly readings The Forrester AI Bubble Model runs a health watch that produces a “nowcast” – e.g. where the health score would fall that week if all the company financials were in. We run this each week to give our clients an updated projections.
Our November 2 data refresh puts the nowcast at 79.1, with a likely range of 77.7 to 81.4 (see Figure 2). It runs on third-quarter filings from seven of the nine, plus share prices up to that day. On October 29, it read 82.1. Amazon’s filing pulled it down, and so did CoreWeave’s shares. Issued health had already slid from 97.7 in the second quarter of 2025 to 82.3. We issue the reading around November 25.
Line chart of build-out health for all nine companies by quarter from 2019Q4 to 2026Q2, with green, yellow, and red bands shaded. Health has stayed green throughout, falling from about 98 in mid-2025 to 82.3 in 2026Q2. A diamond marks the 2026Q3 nowcast of 79.1, with a likely range of 77.7 to 81.4.
The AI Build-Out Is Starting To Outrun Big Tech’s Cash
The Q22026 data shows that Alphabet, Amazon, Meta, and Microsoft were paying for nearly all of their building out of operating cash in September. Third-quarter filings indicate that the cushion is wearing thin.
- Amazon spent $77.3 billion against $42.4 billion of cash. Over 12 months it spent $1.28 for every dollar its operations brought in, up from $1.07 at the June reading. It raised $48.1 billion in bonds and loans in the quarter, and its 10-Q adds a supplier financing facility of up to about $80 billion it can start drawing in 2027.
- Alphabet spent $9.1 billion more than its operating cash. Over a full year its own cash still covers the build, at 89 cents per operating dollar. It also sold $12.4 billion of shares in the quarter.
- Meta outspent its operating cash by $1.2 billion. It filed a $25 billion forward share sale and $12.5 billion of mandatory convertible preferred stock. NVIDIA is putting in $3 billion, according to Yahoo Finance, and AMD says it’s putting in $1 billion. That means some of Meta’s own chip suppliers are now helping pay for the build that buys their chips.
- Microsoft still spends within its cash but borrowed anyway. On November 2 it filed terms for $25 billion of notes, which Reuters, citing a source, reported as its first US investment-grade bond sale in more than nine years.
At the edge of the build-out, Oracle spent $1.61 per operating dollar over the 12 months to August, and on November 2 it filed for $10 billion of new stock and $10 billion of notes. That same day Oracle’s shares were 51% below their 12-month high and CoreWeave’s were 62% below theirs. The overall color is still green; but the money for the build-out is shifting from cash the builders earn to money they raise, which is exactly what the health score measures.
Our Bubble Watch Extends Beyond Public Companies
The Forrester AI Bubble Model scores only the audited financials of public AI compute builders, which is where we get the confidence. However, that leaves out OpenAI and Anthropic, who sit at the center of the bubble question. The model sees what flows to and from them in the public builders’ own filings, and it tracks circular deals. When Anthropic filed its S-1 on October 26, we loaded it into the AI lab tracker that’s part of our model. It doesn’t change the scores, but it does feed into the health watch. When these vendors go public, we will update our model to add them to our basket of companies tracked.
Read An AI Bubble Burst Is Not Imminent, then book a guidance session with one of us for the latest reading. Bring your vendor list, and we’ll look at whose finances you’re relying on.
Categories