US Retail Industry Sales And Profits Trends, 2001–2022: Steady Growth
There’s been a steady increase in US retail industry revenue over the past two decades, per 2001 to 2022 data from the US Census Bureau quarterly financial report’s income statement for retail trade. The industry’s operating income and net income have also steadily increased, with operating margins and net margins remaining relatively stable. Read on for the top retail sales growth trends that we observed from this data.
What Is The QFR?
The US Census Bureau issues a quarterly financial report (QFR) to assess the financial performance of the retail industry. The QFR provides up-to-date aggregate statistics on the financial results of large US corporations based on a sample survey. It provides estimated statements of income and retained earnings, balance sheets, and related financial and operating ratios for corporations in retail trade with assets of $50 million and over.
The US Census provides a QFR for overall retail trade and a few retail subsectors, including food and beverage stores and clothing and general merchandise stores. The data from the QFR income statement for retail trade provides valuable insights into the retail industry’s sales, operating income, and net income.
US Retail Sales Growth Trends
- Aggregate sales of retail corporations with assets of $50 million or more tripled from $1.35 trillion in 2001 to $4.01 trillion in 2022.
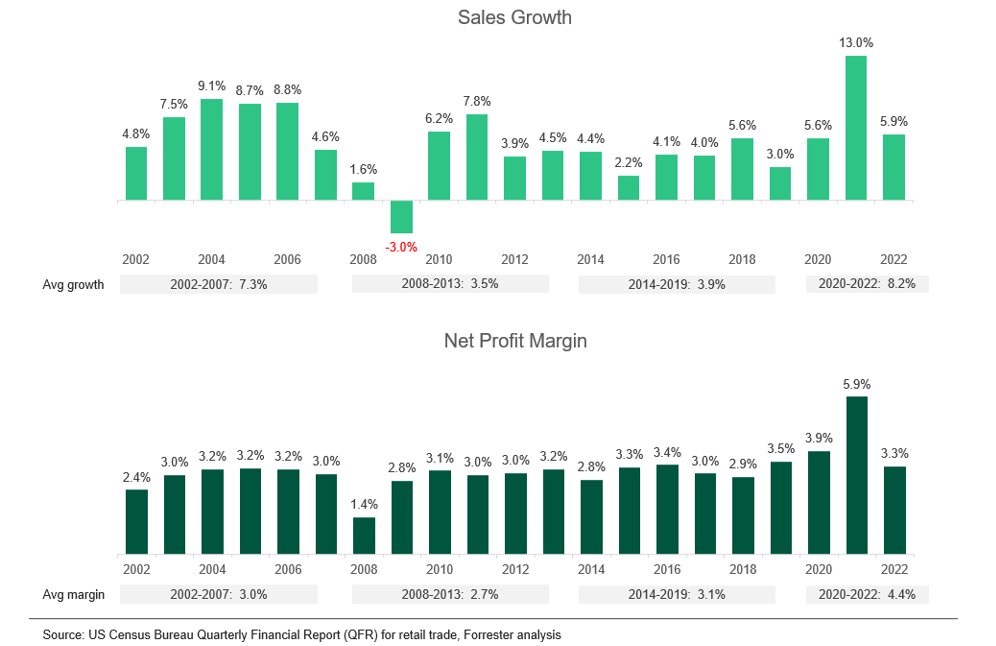
- From 2002 to 2007 (i.e., before the global financial crisis), sales growth averaged 7.3%. From 2008 to 2019, sales grew at an annual average growth rate of 3.7%.
- 2021 witnessed the highest year-over-year growth in two decades at 13.0%. This high growth in 2021 can be attributed to the consumer savings from services spending during 2020 and the stimulus checks that US consumers received from the US government in 2021.
- Growth slowed to 5.9% in 2022 but was still higher than the pre-pandemic average (see figure).
US Retail Industry Sales And Profits Analysis, 2002–2022
US Retail Operating Profit Trends
- Operating profit is calculated by taking operating expenses out of the total sales. The retail industry’s operating profit more than tripled from $58.3 billion in 2001 to $200.9 billion in 2022.
- The retail operating margin remained relatively stable at around 4.5% to 5.0%, except during 2008, when it dipped to 3.9%, and again during 2021, when it increased to 6.0%. This increase in retail operating margin in 2021 can be attributed to the strong increase in retail sales during the year.
- The operating margin came down to 5.0% in 2022.
US Retail Net Profit Trends
- Net profit refers to the income left after income tax payments. The retail industry’s net profit grew 5.5 times from $24.1 billion in 2001 to $132.8 billion in 2022.
- The retail net margin remained relatively stable at around 2.8% to 3.5%, except during 2008, when it dipped to 1.4% and again during 2021, when it increased to 5.9%. The retail net margin in 2021 was the highest in the last two decades.
- The net margin decreased to 3.3% in 2022.
If you are a retailer, you can use the QFR report to benchmark your quarterly or annual sales growth and profit margins with that of the industry. Our US retail competition tracker (available to Forrester clients) provides valuable insights into the overall sales, online sales, profit margins, and sales area of 60 leading retailers in the US. If you are a Forrester client and would like to discuss this further, please schedule an inquiry with me.
Related Forrester Content
Categories