Takeaways From Our Latest US Online Grocery Market Review
Forrester partnered with IRI, a global leader of market intelligence in the retail and consumer packaged goods world, to understand the size and scope of online grocery in the US. We’ve been closely tracking significant changes in online grocery for a little over two years. In our most recent (Q4 2021) online grocery snapshot, we highlight some key market trends:
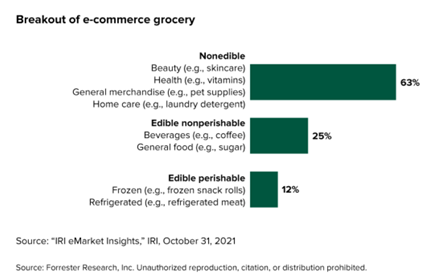
- Online grocery is still primarily nonedible dry goods. The grocery category is diverse and comprises thousands of items ranging from milk to coffee beans to paper towels. Forrester worked with IRI to aggregate products into three categories that encompass product sales at grocery stores: nonedibles/nonfood, nonperishable edibles/food, and perishable edibles/food. In our most recent market analysis, we found that nonedible categories (i.e., beauty, health, pet supplies, and home care) comprise 63% of online grocery sales (Figure 1).
- Edible grocery is growing. While nonedible items capture the majority of the online grocery market, food as a percentage of e-commerce is now bigger than ever, currently comprising 37% versus 26% before the pandemic.
- While online grocery categories are growing overall, growth has decelerated since October 2020. Seven of the eight grocery subcategories reached peak growth midpandemic in October 2020. Since then, all grocery subcategory growth rates have declined, and five out of the eight categories have even lower growth rates than pre-pandemic levels in January 2020.
Figure 1 Edible Grocery Now Constitutes 37% Of Online Grocery Sales
Check out our most recent report for the full picture or any of our previous grocery snapshots for insights into the evolution of the online grocery space over the past two years. Please let me know if you have any questions — Forrester clients, my fellow analysts and I are happy to speak with you via inquiry.
(Cowritten with Taylor Hansen, research associate)
Related Forrester Content