Understanding Metric Maps: Measure What Matters For Adaptive, Resilient Operations
IT leaders face significant challenges in developing effective performance models. The complexity of data integration, strategic misalignment, and resistance to change often hinders metric alignment with dynamic organizational needs.
The Problem With Traditional Metrics
Traditional approaches to performance metrics often misguide decision-making. Organizations struggle with excessive metrics, fragmented measurement systems, and outdated performance models that fail to align with strategic goals.
Misalignment with strategic goals can result in fragmented systems and customer dissatisfaction when metrics overlook broader business objectives. An overreliance on activity-based metrics may lead to inefficiencies by prioritizing task completion over quality outcomes, diverting resources from strategic aims.
Additionally, non-relevant KPIs, developed without adequate validation, can be inconsistent, overlooking crucial qualitative factors such as customer satisfaction. Data integrity issues further erode trust in performance models, causing inaccuracies and fragmented perspectives. Furthermore, a lack of adaptive measurements that respond to business cycles and technological changes can hinder innovation, while an excessive dependency on outdated best practices may create rigid frameworks that fail to address unique contextual needs.
Forrester recommends four categories of performance model archetypes to inform decision-making:
- Operational health KPIs. Monitor and improve the efficiency, reliability, and performance of IT infrastructure and services.
- Service dashboards. Visually present KPIs to monitor end-to-end service performance and make informed decisions using real-time data.
- Metric maps. Diagnose and fix problems with services or processes, tracking the adoption of improvement plans.
- Employee experience. Measure the end user’s experience to boost morale, engagement, and retention.
The Role Of Metric Maps
Metric maps are a powerful tool for diagnosing and fixing problems with services or processes. They use objectives and key results to track improvements through each step of adoption, indicating early success, continued success, and outcome achievement. By integrating continuous feedback and communication, metric maps create a dynamic and responsive performance tool that supports employee growth, enhances engagement, and drives overall business success.
Here is an example of a metric map for a common challenge in service management — a lack of resources to get things done. In this case, the problem statement is defined as: Incident volumes continue to increase, and the organization doesn’t have enough people to meet expectations. The objective is to increase automation and self-service to reduce incident volume and increase productivity.
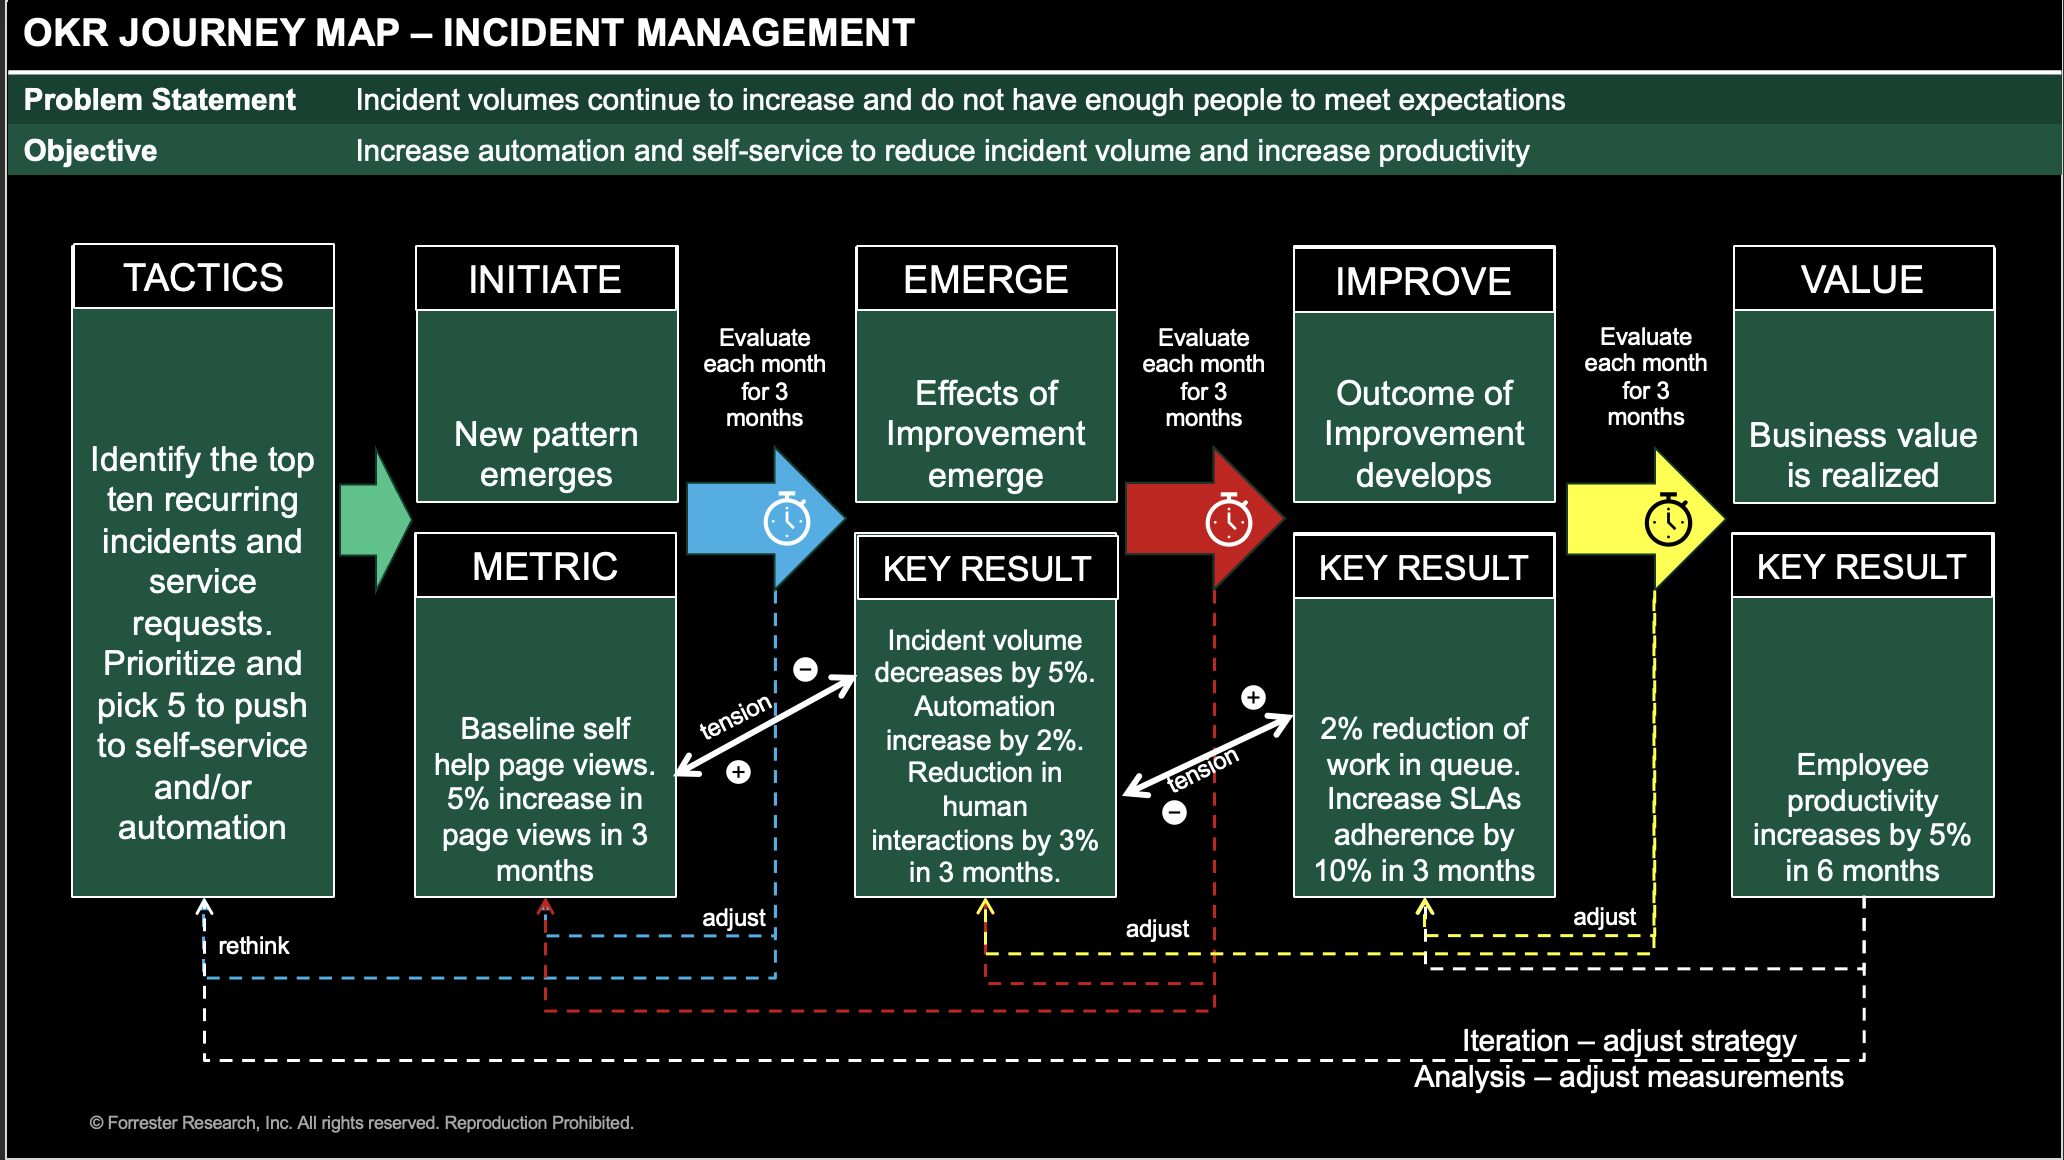
But you can’t use the measurement of productivity as your North Star. It may take months to see any positive change. Instead, break down the improvement opportunity into stages of initiate, emerge, improve, and value, then identify metrics that will indicate that progress is being achieved.
Effective performance modeling is critical for adaptive and resilient operations. Organizations can overcome traditional metric challenges and drive continuous improvement by prioritizing metric maps and leveraging the four performance model archetypes. Embracing adaptive measurements and fostering a performance culture will ensure that IT leaders can align metrics with dynamic organizational needs and strategic goals.
Let’s Connect
Have questions? That’s fantastic. Let’s connect and continue the conversation! Please reach out to me through social media or request a guidance session. Follow my blogs and research at Forrester.com.
Related Forrester Content