Total Experience Score, 2026: Growth Breaks When Experiences Fragment
The brands pulling ahead are aligning brand, customer, and employee experience in ways that make growth easier to win — and harder to lose.
Most companies still manage brand experience (BX), customer experience (CX), and employee experience (EX) as separate disciplines. That may work on an org chart, but it fails in the market. Customers do not experience your structure; they experience the promise your brand makes, the reality your business delivers, and the consistency with which your people make both believable. When those forces align, growth gets easier. When they do not, growth gets more expensive, fragile, and hard to sustain.
That is the clearest lesson in Forrester’s Global Total Experience Score Rankings, 2026: The brands pulling ahead are aligning brand, customer, and employee experience into a system that creates momentum.
The 2026 Growth Story
The data makes the value of orchestrating a system of BX, CX, and EX compelling. We analyzed 406 brands across 13 countries and 11 industries using more than 350,000 consumer perceptions. Of the 375 brands measured in both 2025 and 2026, 41% improved and only 3% declined. North America showed the strongest momentum, with 53% of both US and Canadian brands moving up.
But the more revealing story sits underneath: In the US, gains came more from noncustomers, signaling stronger market pull; in Canada, gains came more from customers, signaling stronger delivery — same upward movement, different growth dynamics. Topping the US brands was USAA (as a bank), with a Total Experience Score of 69.0 on our 100-point scale. Leading among the Canadian brands was RBC Dominion Securities, at 60.0.
Forrester’s Total Experience Is Even More Complete This Year
This year, Forrester’s research adds the final piece to a complete system of indexes that leaders should not overlook: That piece is our new global Employee Experience Index (EX Index™). It shows whether the organization behind the brand is actually capable of sustaining the experience it delivers. That’s not just a “culture” talking point or an HR side conversation — it’s an operational reality.
Employees are not adjacent to the experience; they are the mechanism through which it happens. And in the US, the signal is impossible to ignore: Only 25% of brands with EX data had a positive EX impact on their total experience, while 37% had a negative EX impact. Too many companies are trying to build customer loyalty and brand strength on top of internal conditions that may be undermining both.
Forrester’s Total Experience Score Forces Better Questions And Informs Better Decisions
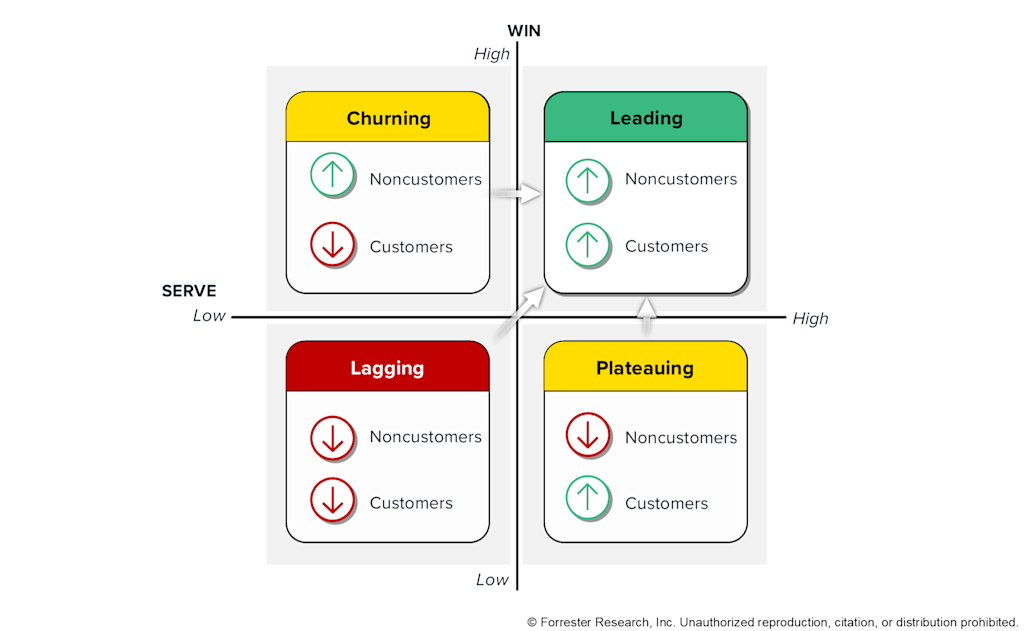
Why does the Total Experience Score matter? It doesn’t allow leaders to hide inside a single metric or confuse isolated strength with durable advantage. It forces a better question: Can your company win customers and serve them well enough to keep growing? Half of the score reflects how noncustomers see the brand. The other half reflects the customer experience, informed by both CX and BX data. That matters, because too many companies still mistake brand awareness for strength or loyalty for future growth.
Our Total Experience Score growth grid tells the story: It shows whether brands are leading, plateauing, churning, or lagging. Plateauing brands are loved by the customers they already have but are invisible to the customers they need next. Churning brands generate demand but cannot turn it into lasting relationships. Lagging brands struggle to either win or serve customers, while leading brands succeed at both. These are not abstract categories. They are four very different growth realities.
The regional standouts make the point. Nationwide Building Society led Europe for the second year in a row with a score of 63.3. Santander Bank in Spain was the most improved, up 4.0 points. Halifax Share Dealing posted the smallest gap between customer and noncustomer scores — a reminder that alignment itself is a competitive asset. In Asia Pacific, Bendigo Bank led in Australia, HDFC ERGO led in India, and DBS led Singapore’s investment firms. Despite different markets, the same lesson comes to the fore: Growth gets easier when promise and delivery move in unison.
Global Data: A Closer Look At What The Regions Reveal
Europe and Asia Pacific were largely stable, with most brands holding their ground. But stability is not the same as strength. Flat performance can signal resilience, but it can also signal stagnation. The industry patterns tell the same story. In the US, hotels posted the highest industry average at 61.7, while auto and home insurers improved the most, gaining 4.5 points. In Canada, investment firms had both the highest average and the greatest gain. In Europe, bank averages improved in five of the eight countries studied, while Italy’s auto and home insurance sector and UK investment firms also moved up. In Asia Pacific, banking improved in Australia and India, while Singapore saw declines in investment firms and health insurers.
The Bottom Line Is Simple
Growth breaks when brand experience, customer experience, and employee experience pull in different directions. When they reinforce one another, companies build trust, reduce friction, deepen loyalty, and create enduring momentum. When they do not, strong performance in one area can hide weakness in another but not forever. That is why Forrester’s Total Experience Score matters now. It is not just a better metric. It is a better lens on where growth comes from — and why it fails.
Learn more about Forrester’s Total Experience Score and research at an upcoming CX event.
Related Forrester Content